The south of Glasgow has long been an area of the city favoured by people from diverse ethnic backgrounds and contains the highest densities of people from these groups in both the Glasgow City Council local authority area and the NHS Greater Glasgow and Clyde Health Board area.
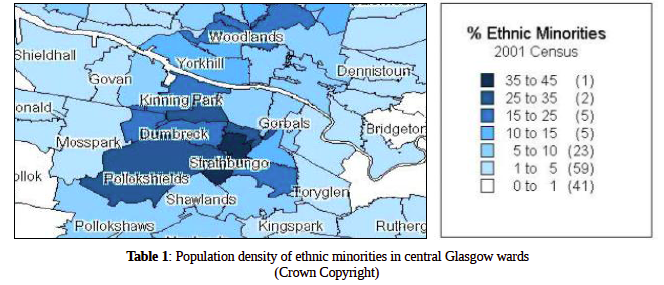
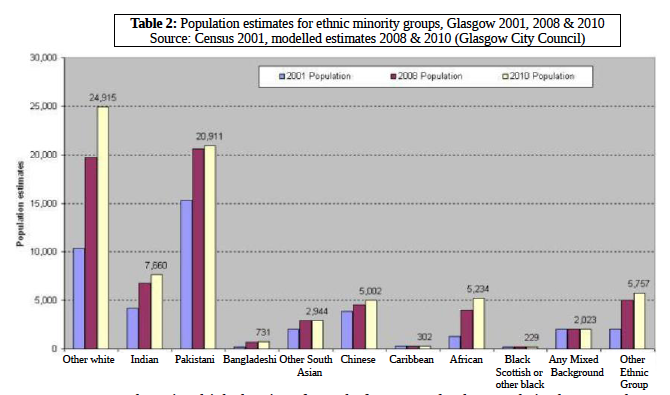
Some movement in these population densities is estimated since 2001 due to an influx of people who fall into the “Other White” ethnic minority category throughout the 2000s, as more European nations joined the European Union, facilitating unrestricted movement of people from nations such as Poland and Romania, many of whom arrived in the area seeking employment. However, populations of south Asians (Pakistani and Indian) and Africans have continued to rise in the period since 2001 (see Table 2) and remain concentrated in the south of Glasgow, where their social, family and work networks are located.
Because there is a high density of people from BME backgrounds in the area, there are also more organisations present who aim to provide services to this group. As well as providing a rich source of research material for a study of this nature, these circumstances provide the opportunity for study of the effectiveness of the increased rate of interventions taking place in the area. However, given that this area has the highest population density of this group in Scotland, and therefore the largest range of services available, it is atypical of the rest of Scotland and the findings need to be viewed in this context.
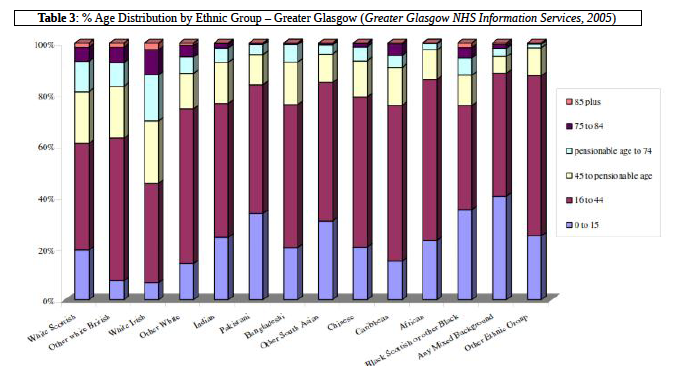
The age profile of people from ethnic minority backgrounds shows that the proportions of older people is smaller than in the indigenous white population (see Table 3). However, these proportions will change over time as existing immigrant populations age. One estimate suggests the number will multiply by a factor of ten from 230,000 older ethnic minority (non¬white) people in 2001 to 2.7 million in 2051 (8) in England and Wales alone.
This study focusses on the older people (aged over 65) who live in the most settled migrant groups, for whom the periods of adjustment at individual, infrastructural and systemic level, have been longest. These people continue to live primarily in south¬central Glasgow and the study concentrated on this geographical area.
The 2001 census indicates that across the whole of Glasgow 19% of the white population is over 65 whilst just over 5% of the Black and Minority Ethnic population was over 65 (9). However, recent population projections for BME older people suggest steep increases in proportions of older people (Wohland, P. 2010 (10); Lievesley, N. 2010 (11)). Of the eight wards that comprise Glasgow South social work area, the population in June 2011 of people over the age of 65 was 30,144 – 13.7% of the total population (12).
Govanhill, one of wards at the heart of this geographical area, has seen a 14.1% drop in the population of people of white Scottish, British or Irish origin and a 10.4% increase in people from BME backgrounds in the period 2001 – 2008 according to Glasgow City Council estimates. The total BME population (including “Other White” category) living in Glasgow South social work area in 2010 is estimated at 31,641.
This is nearly half of the total BME population living in Glasgow and suggests the number of older people from ethnic minority backgrounds living in the south of Glasgow is somewhere between 2,000 and 3,000 individuals.
For this report, the researchers spoke to 97 older people living in the area who were from BME groups. Two thirds of these gave their ethnic origin, with 92% of these being from Pakistani or Indian backgrounds and the remainder being of Iranian, Bengali, Afghani, Romanian or Somalian backgrounds.
(8) The health and social care experiences of BME older people – Better Health Briefing Update 9, Moriarty J, 2012,
(9) Ethnic Group Profile from the 2001 Census NHS Greater Glasgow Area, Boyd, A et al, GGNHSB Information Services 2005
(10) Ethnic Population Projections for the UK and Local Areas, 20012051, Wohland, P., Rees, P., Norman, P., Boden, P. & Jasinska, M. (2010) Leeds: University of Leeds, School of Geography.
(11) The Future Ageing of the Ethnic Minority Population of England and Wales, Lievesley, N (2010) London: Runnymede Trust/Centre for Policy on Ageing.
(12) Glasgow City Council Social Work Area Demographics Report, Mokrovich J, Performance and Research Team, Social Work Services Glasgow City Council, 2011.